Adil Zeshan
I enjoy creating data visualisations and simulations. And I like writing readable and debuggable code that makes for a happy and meaningful developer experience. Code is a form of future communication not so much to the compiler but to collaborators and my future self.
Below are a few of my ongoing projects, each with links to a live demo, source code, and roadmap.
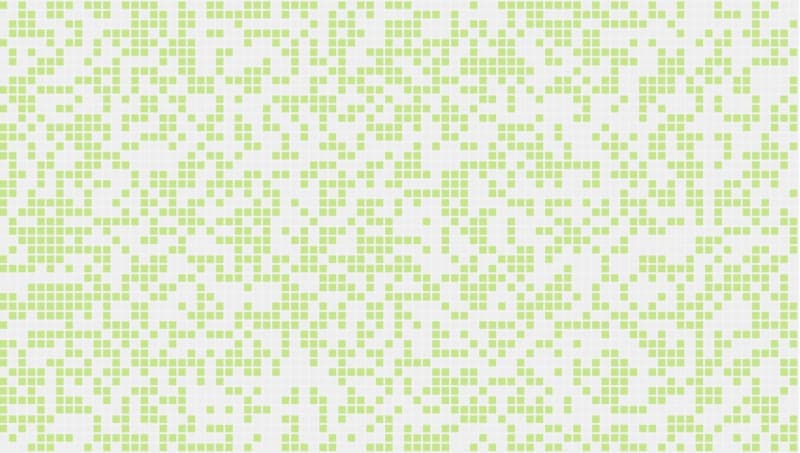
Conway's Game of Life Simulation
Built with vanilla JavaScript, HTML5 canvas, and CSS. It was structured using MVC principles to cleanly separate communication concerns, and made heavy use of the module pattern and closures, as well as recursive and asynchronous code. More features will be added over time (see roadmap).
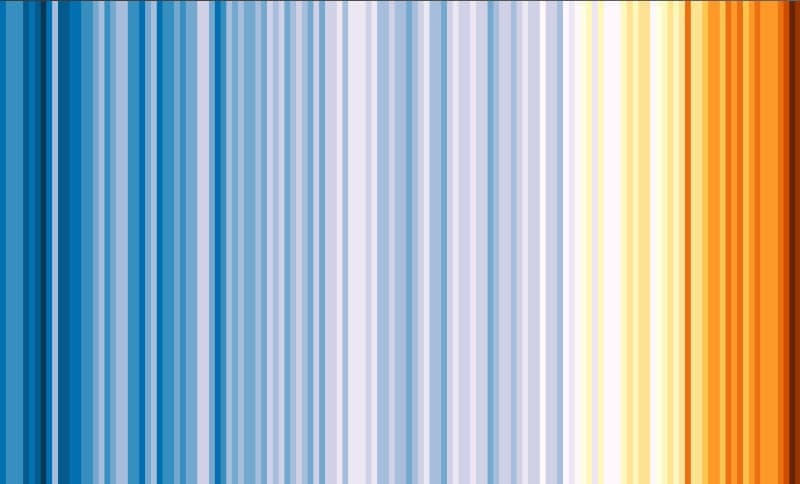
Warming Stripes
Built with vanilla JavaScript, D3.js, and CSS. It is interactive. The data is taken from NASA. More features and data will be added over time (see roadmap).
Mandelbrot Set
Built with JavaScript and HTML5 canvas. It is a work in progress. The aim is to make it interactive, as an (infinitely) zoomable fractal without any loss of detail. This and other features will be added over time (see roadmap).